Brown County has a diverse and growing community of amazing youth. We believe that to best serve our youth, we need to first understand who makes up our community. Below are some demographic data sets about the youth in our schools, including students who are economically disadvantaged, have a disability, and data about English learners. These are more than just numbers. They are insights into the makeup of our community that inform how we work to achieve our goals.
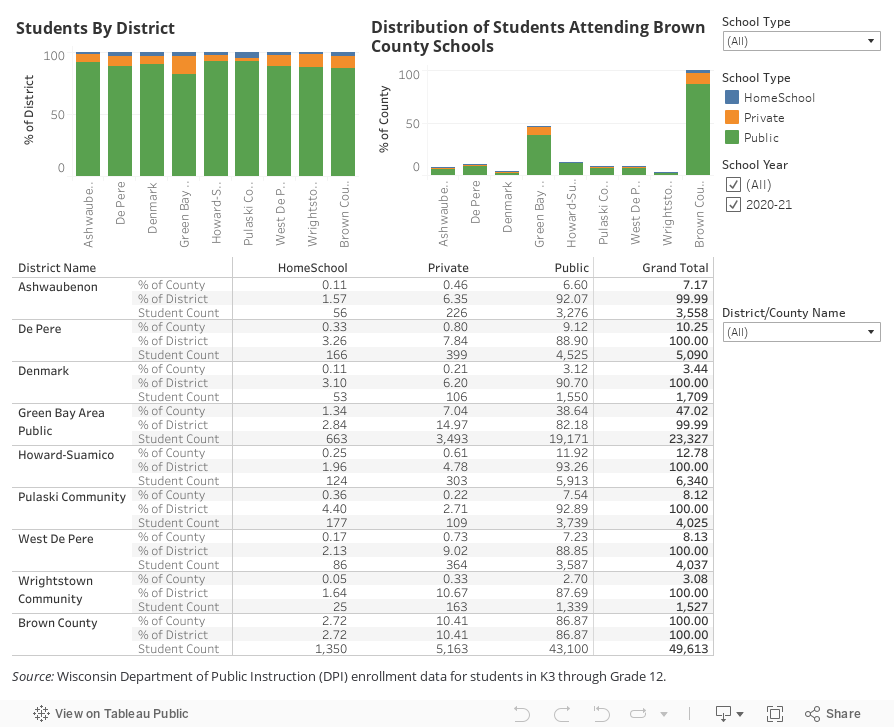
Students and Schools
Students with Disabilities
Disability Status indicates that a student has been reported by the school district as needing special education and/or related services. This covers the areas of autism, blind and visually impaired, deaf and hard of hearing, deafblind, emotional behavioral disabilities, intellectual disabilities, orthopedic impairment, other health impairment, significant developmental delay, speech or language impairments, specific learning disabilities, and traumatic brain injury.
Disability is the most disabling condition of an IDEA-eligible student’s impairment. Disability codes are defined by the U.S. Office of Special Education Programs (OSEP) and used for disaggregated federal and state accountability reporting.
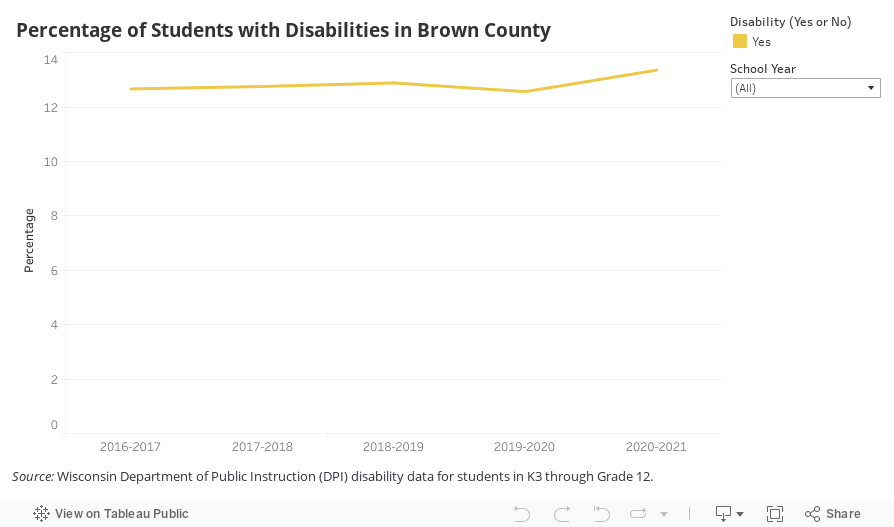
The following visual shows the percentage of students with disabilities attending Brown County public schools.
In the 2020-2021 school year, 13.36% of students were reported by the school district as needing special education and/or related services.
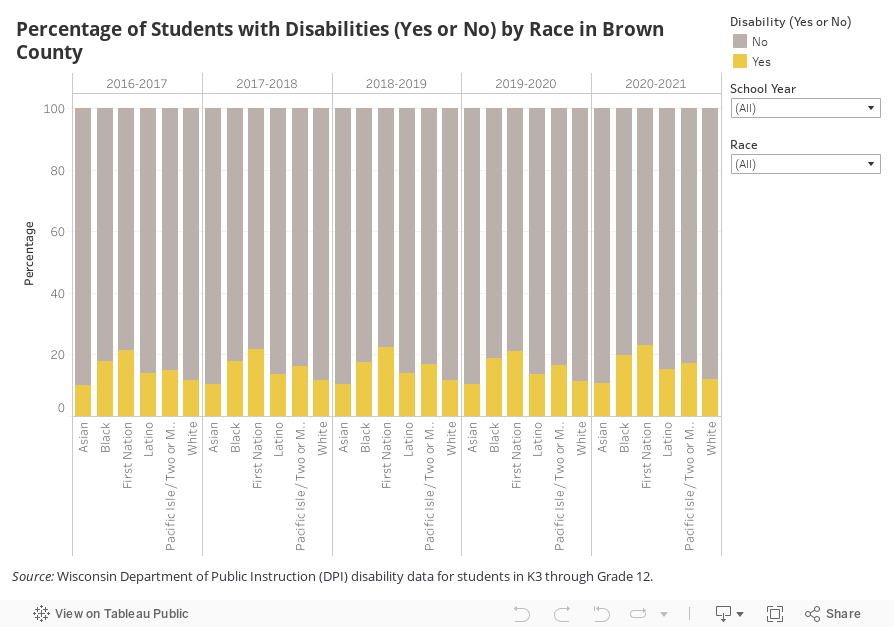
The following visual shows the percentage of Brown County public school students with disabilities within each race/ethnicity student group.
When comparing rate of disability status within each student group by race/ethnicity, First Nation had the highest percentage of disabled students and Asian had the lowest percentage of disabled students from 2016-2017 to 2020-2021.
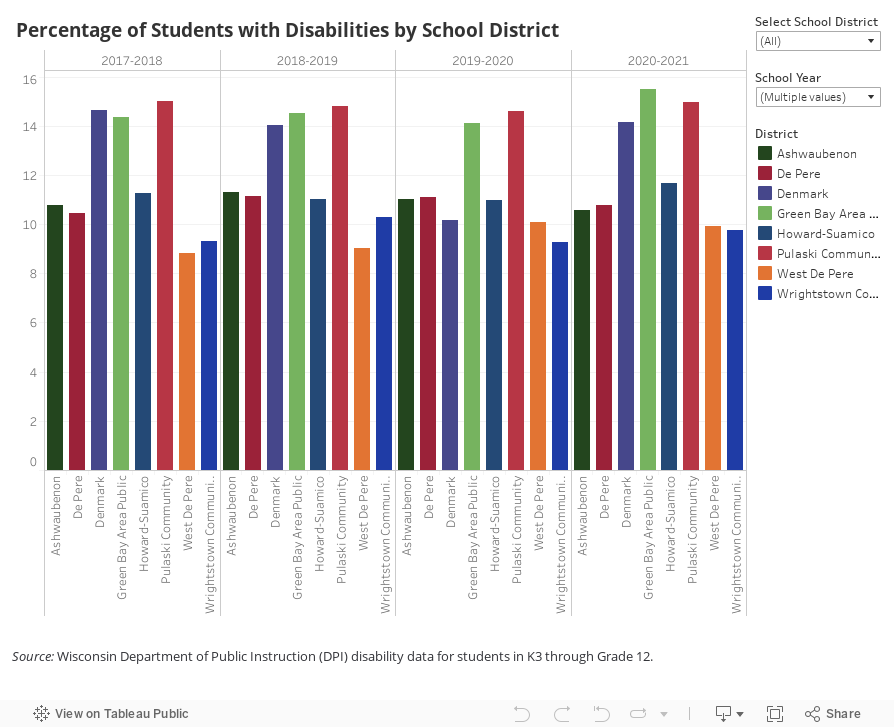
The following visual shows the percentage of students with disabilities within each Brown County public school district.
Economically Disadvantaged Students
Students are counted as being economically disadvantaged based on membership in a household that meets the income eligibility guidelines for free or reduced-price meals under the National School Lunch Program (NSLP) or an approved alternative mechanism.
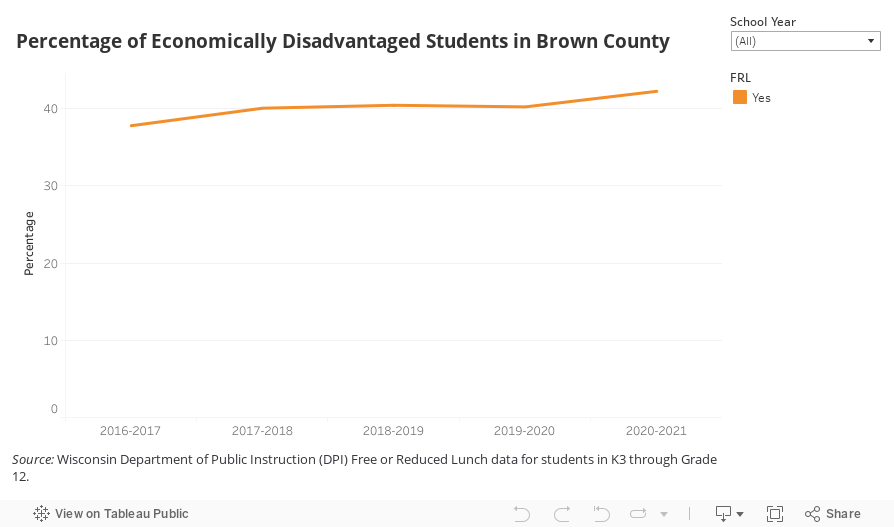
The following visual shows the percentage of economically disadvantaged students attending Brown County public schools.
In the 2020-2021 school year, 42.27% of students were counted as economically disadvantaged. From 2016-2017 to 2020-2021, the percentage of economically disadvantaged students in Brown County public schools has grown from 37.81% to 42.27%, an increase of 4.46% (1,239 students) over 5 school years.
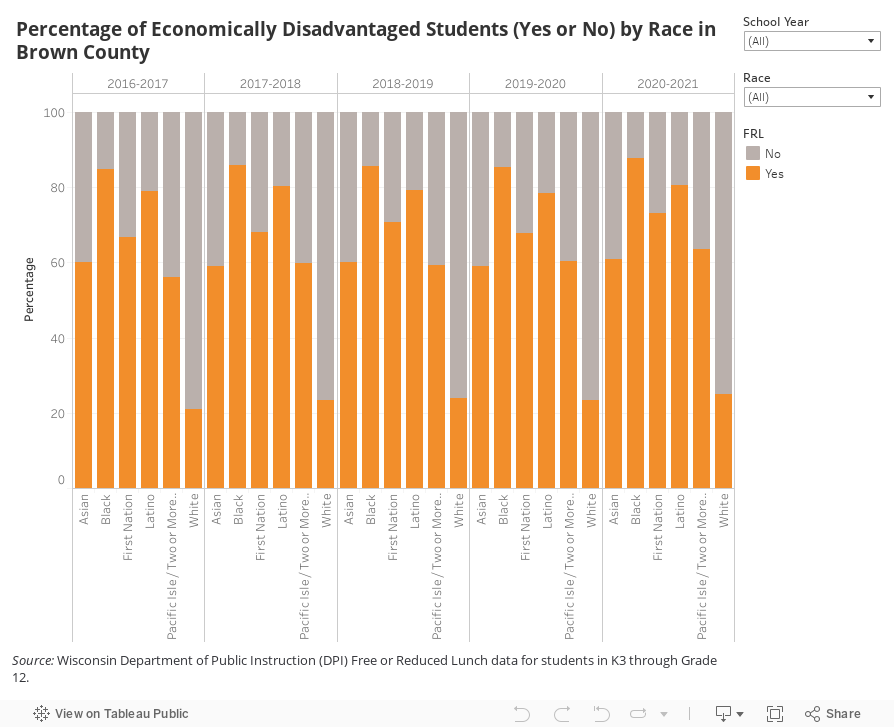
The following visual shows the percentage of economically disadvantaged Brown County public school students within each race/ethnicity student group.
When comparing rate of economically disadvantaged students within each student group by race/ethnicity, Black (87.77%) had the highest percentage of economically disadvantaged students and White (24.9%) had the lowest percentage of economically disadvantaged students in 2020-2021.
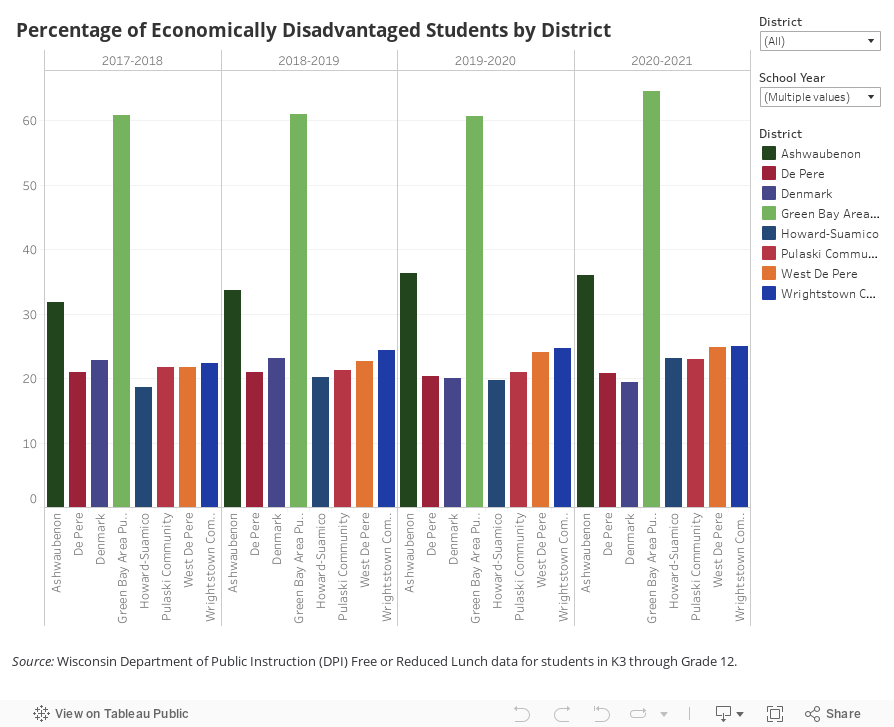
The following visual shows the percentage of economically disadvantaged students within each Brown County public school district.
English Learners
An English Learner is any student whose first language, or whose parents’ or guardians’ first language, is not English and whose level of English proficiency requires specially designed instruction, either in English or in the first language or both, in order for the student to fully benefit from classroom instruction and to be successful in attaining the state’s high academic standards expected of all students at their grade level.
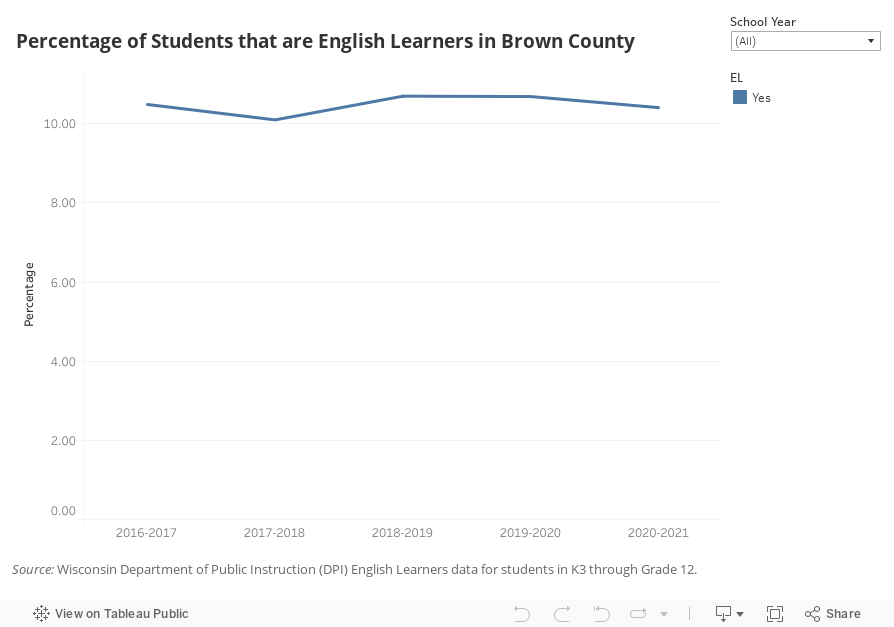
The following visual shows the percentage of English learners attending Brown County public schools.
In the 2020-2021 school year, 10.41% of students were English Learners.
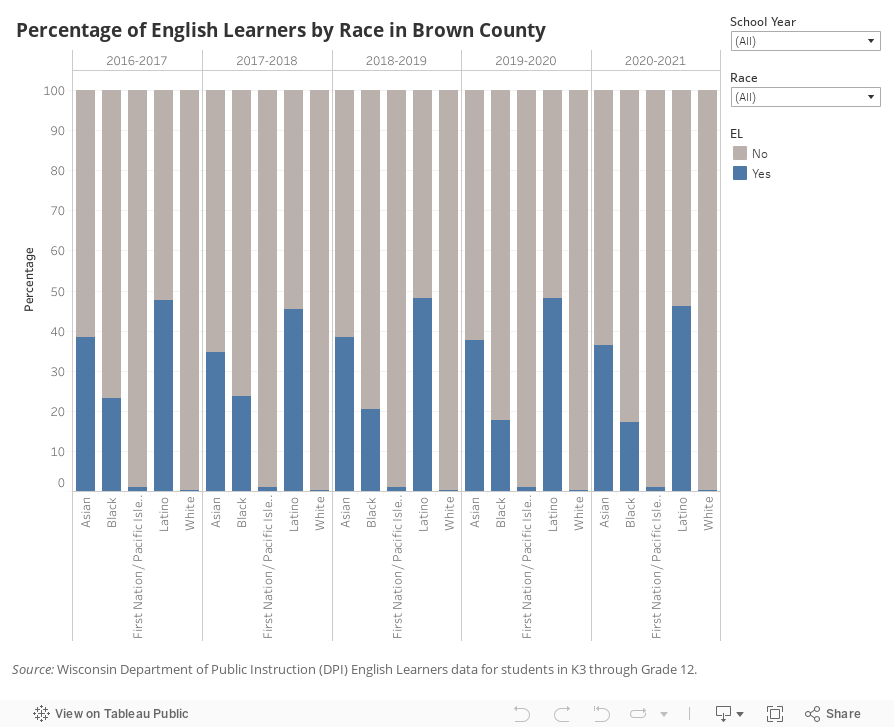
The following visual shows the percentage of Brown County public school students who are English learners within each race/ethnicity student group.
When comparing the rate of English Learners within each student group by race/ethnicity, Latino (46.03%) and Asian (36.35%) had the highest percentage of English Leaners in 2020-2021.
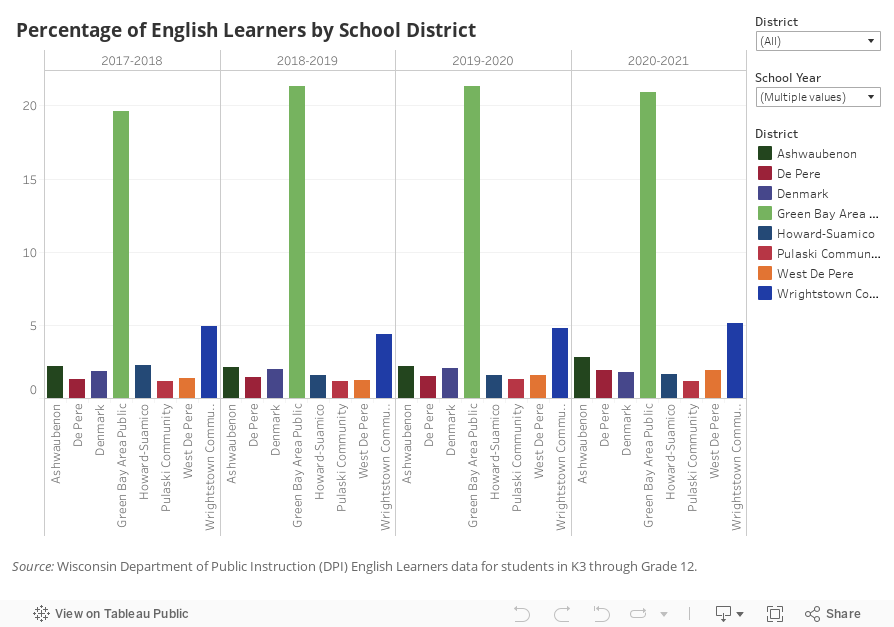
The following visual shows the percentage of students who are English learners within each Brown County public school district.
From 2016-2017 to 2020-2021, both Green Bay Area Public Schools and Wrightstown Community School District have the largest percentage of English Learners. During the 2020-2021 school year, 20.92% of Green Bay Area Public Schools students and 5.14% of Wrightstown Community School District students were English Learners.
Students by Race
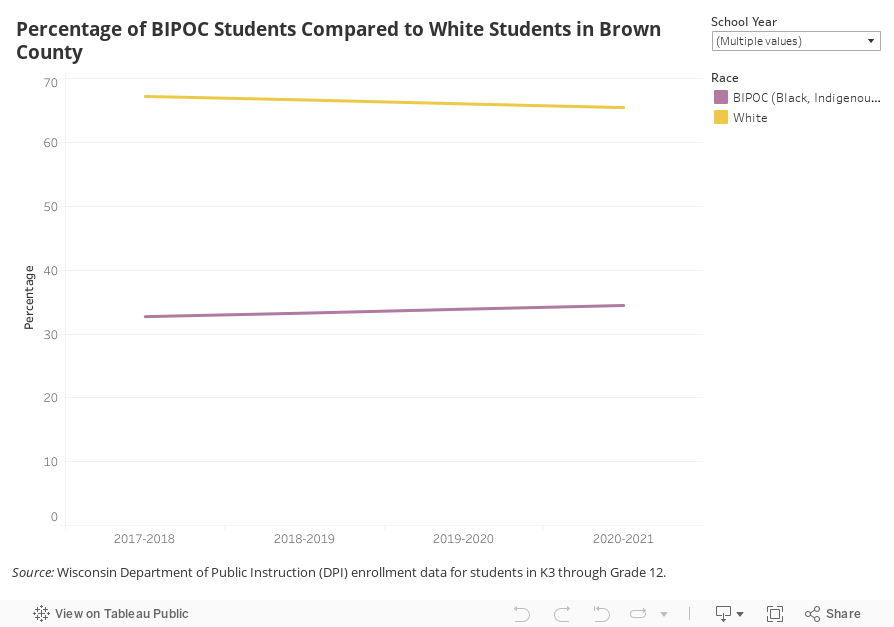
This visual shows the percentage of BIPOC (Asian, Black, First Nation, Latino, Pacific Islander, Two or More, and Unknown) and White students in Brown County public schools each year.
From 2016-2017 to 2020-2021, the percentage of BIPOC students in Brown County public schools has grown from 32.74% to 34.49%, an increase of 1.75% (223 students) over 5 school years. Meanwhile, the percentage of White students in Brown County public schools has decreased from 67.26% to 65.51% (1,814 students).
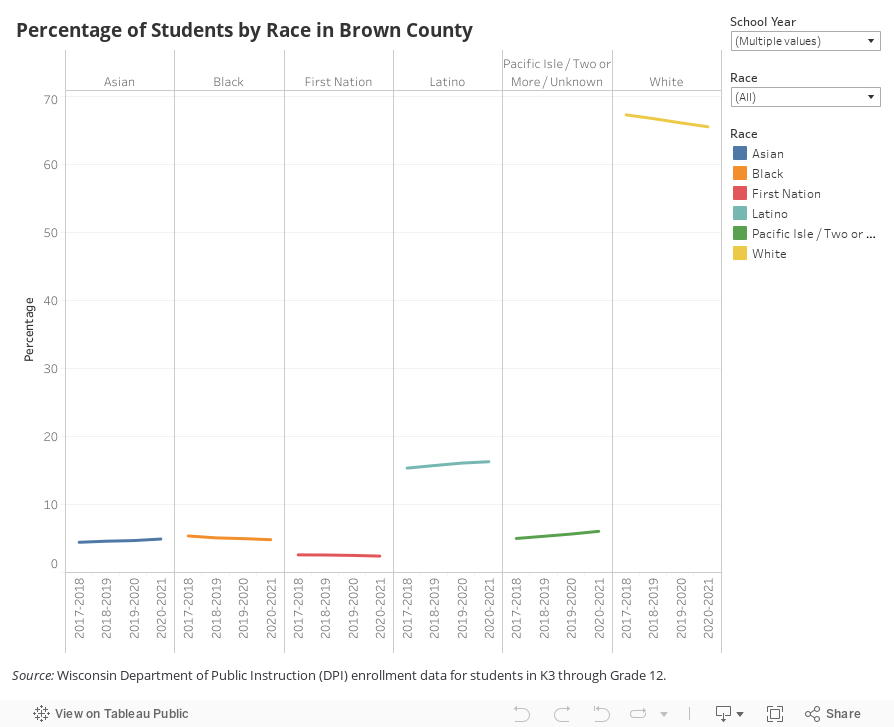
This visual shows the percentage of Brown County Public school students by race year over year.
The Latino student population and the Pacific Isle/Two or More/Unknown population grew the most from the 2016-2017 to 2020-2021 school years. There was a 0.94% increase, or 157 students, in the Latino population. In the Pacific Isle/Two or More/Unknown there was a 1.05% or 370 student increase.
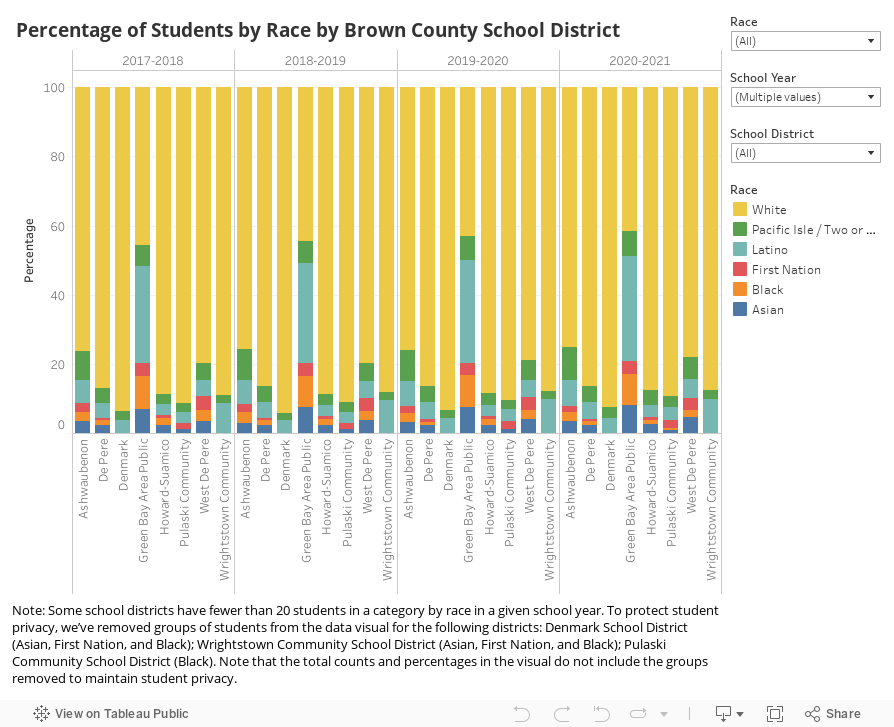
The visual shows the percentage of students by race within each Brown County public school district.
Green Bay Area Public Schools had the highest percentage of BIPOC students in 2020-2021 at 58.45%. Ashwaubenon had the second highest percentage at 24.8% and West De Pere had the third most at 21.95%.