Originally posted July, 2025 | Updated October, 2025
Data is power.
Achieve Brown County is changing our communities power dynamics by providing important data publicly and accessibly. Partners and Backbone Staff have developed a set of interactive dashboards to understand our community and our young people.
Here’s a look at the tools available now, and a preview of what’s coming soon:
Each of our dashboards are built using Power BI, a data visualization and analytic software. Users can explore interactive maps, filter by groups, geography, and other demographics to tailor insights to their specific interests or needs.
Youth Outcome Dashboard
The Youth Outcome Dashboard tracks how our community is performing across the seven key milestones in a young person’s development—from birth to entering the workforce. This dashboard offers a high-level view of the cradle-to-career outcomes.

One of the outcomes on this dashboard is Early Grade Reading. This outcome has a shared community goal to ensure all third graders are reading at grade level by the end of third grade. Community partners established this goal and are taking collective action to achieve it. This community wide effort is called the Reading for the Future Initiative. Reading for the Future Initiative »
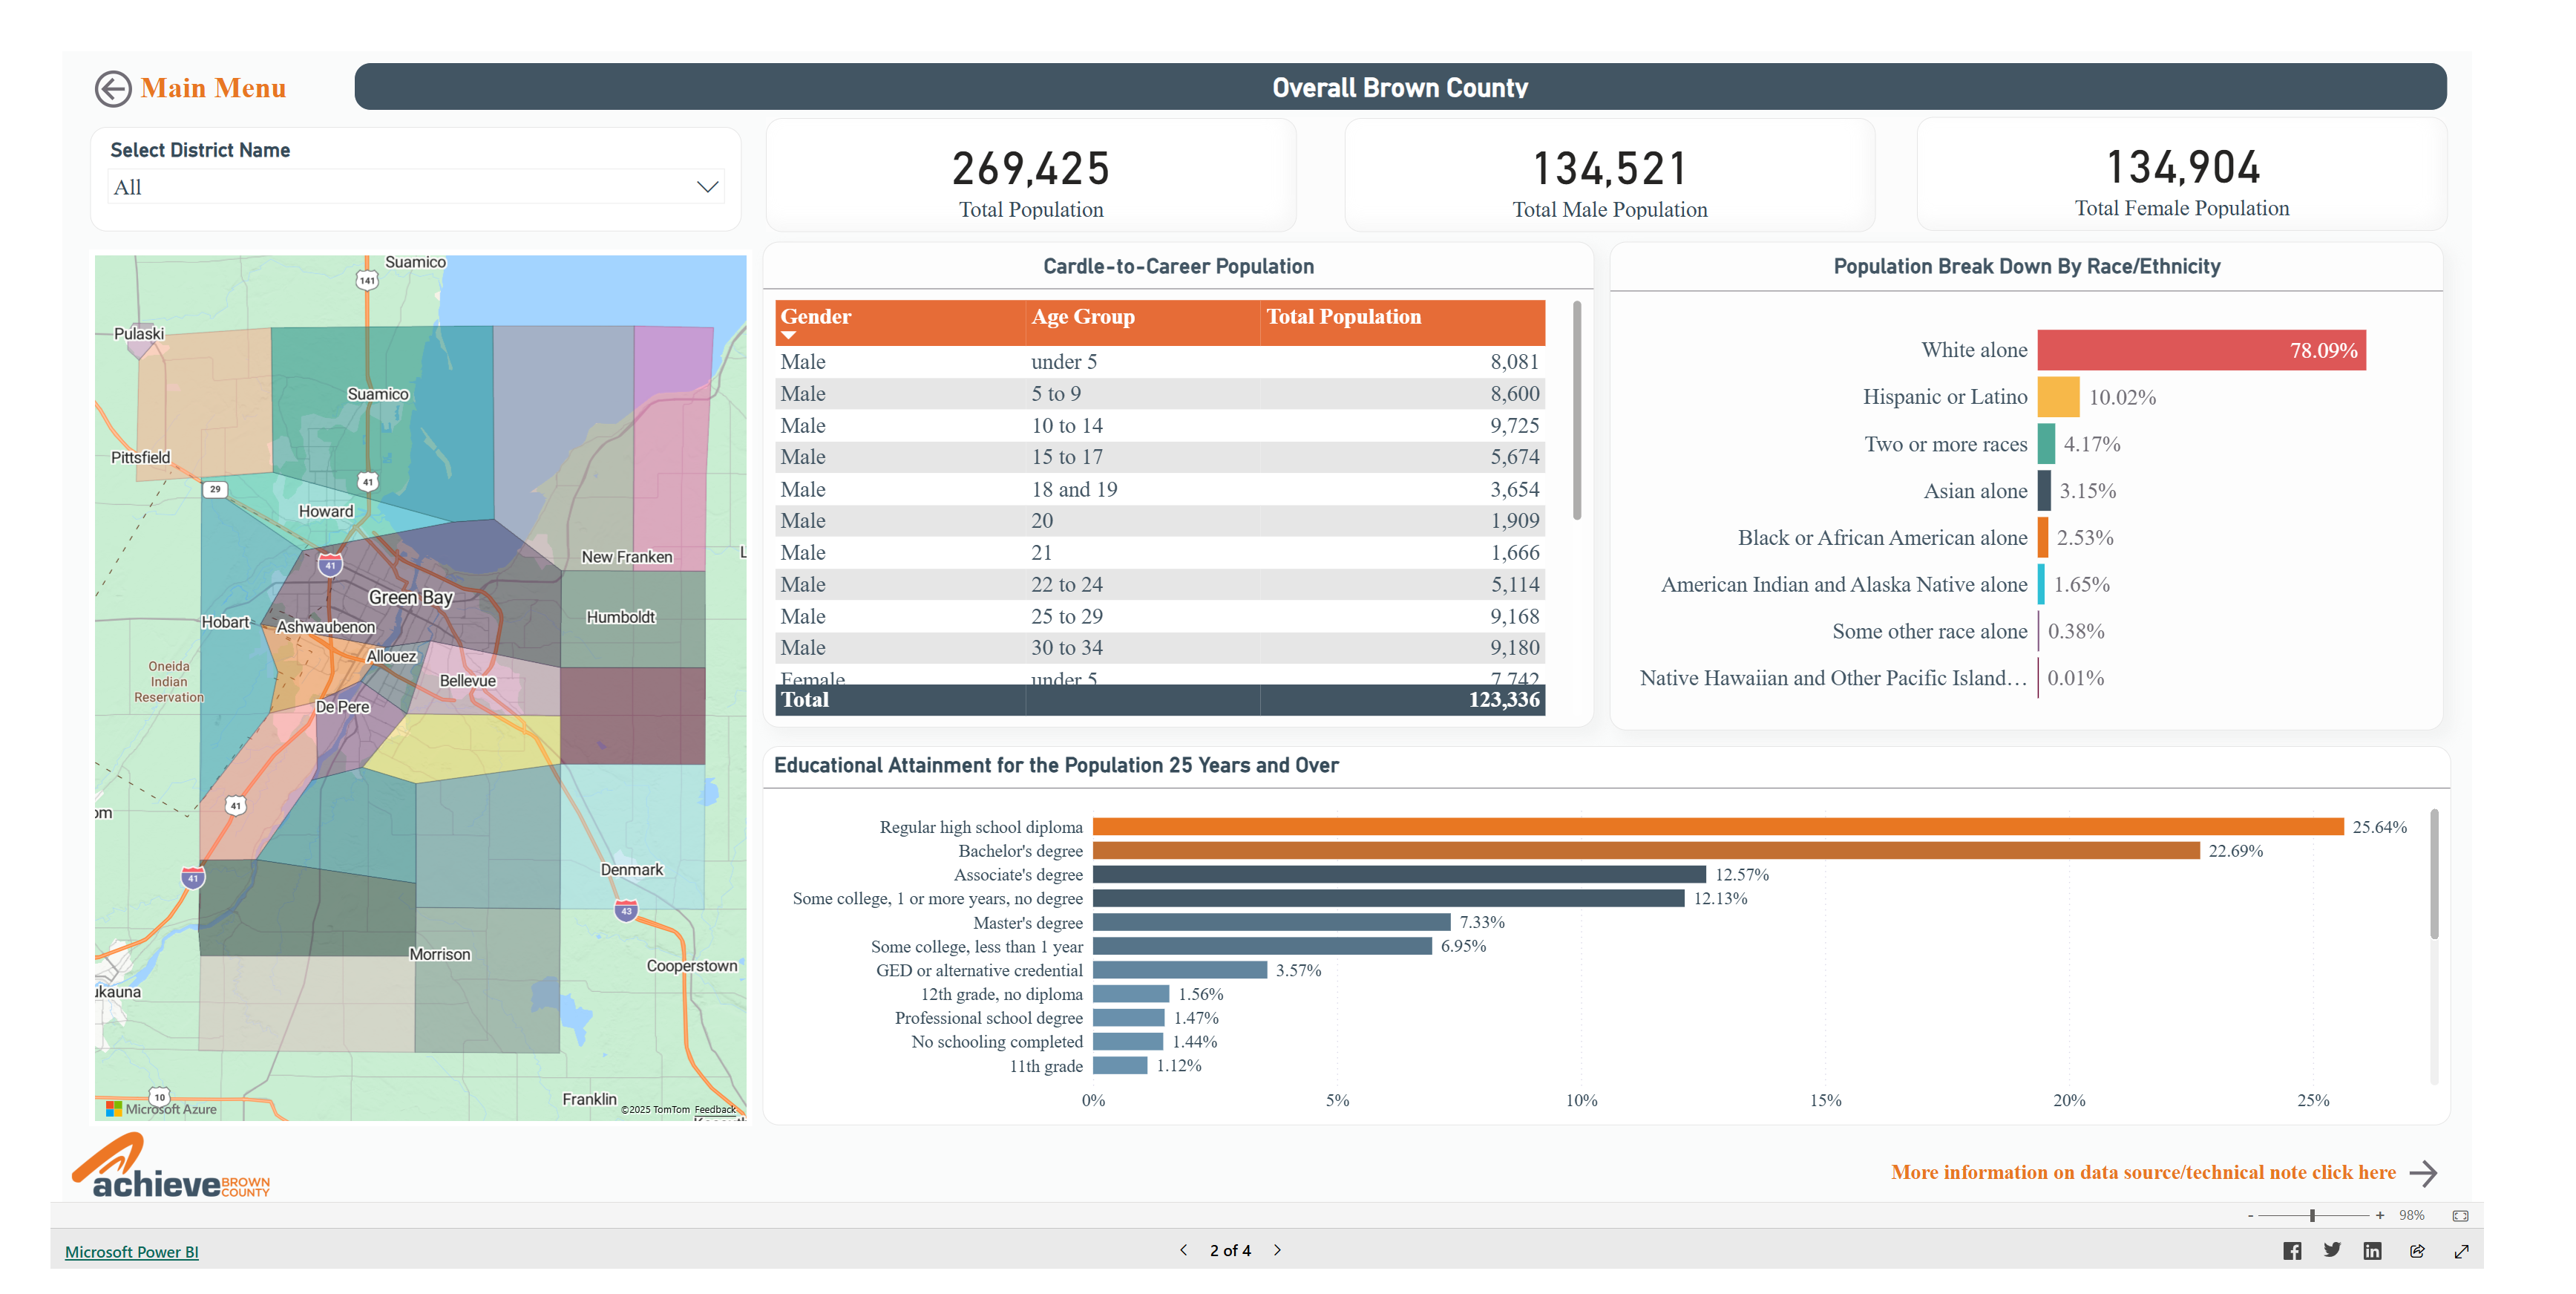
Brown County Overview Dashboard
Understanding who makes up our neighborhoods and community is essential to understanding where a system may not be serving our young people. That’s where our Brown County Overview Dashboard comes in.

This dashboard includes a Population & People Overview, an Economic Overview, and a School District Overview. This dashboard is a resource designed to help users ground their efforts in the realities of our local demographics and economy, because we can’t close gaps we don’t understand.
Coming Soon: Early Literacy Dashboard
To better understand and improve our Early Grade Reading Outcome, we’re developing a new Early Literacy Dashboard—focused specifically on the indicators that shape literacy development from birth through third grade.
While the Youth Outcome Dashboard shows where we are, the Early Literacy Dashboard will help us understand how we get there. It will track things like access to early learning, family engagement, and developmental milestones which contribute to young people becoming proficient readers.
This new tool is being built collaboratively by our Reading for the Future Strategy Team and Backbone Staff members, guided by input from literacy focused organizations, early childhood education providers, and other people and organizations from across Brown County. Because real systems change requires all of us coming together and working together.
Stay Connected to Achieve Brown County
- Sign up for our newsletter
- Attend an upcoming Intro to Achieve Brown County session
- Follow us on Facebook and LinkedIn